Help Center
Home > Help Center > Analytics
Analytics
This page gives a complete understanding of how the chat interface is performing. And allows to explore the data collected using a chat interface.
These metrics shown in dashboards help you make the best possible business decisions.
Analytics are mainly related to the specific chat interface.
Check each metric in detail from the left side menu.
Indicators
The indicators dashboard shows various performance metrics for the data collected for a chat interface.
These visualizations help you understand how your chat interface is performing.
- Conversation insights
This metric shows the data for the selected chat interface for a specified duration. These metrics help you in understanding how many new unique visitors used the chat interface on a particular day.
Total Conversations: Indicates how many conversations started over a chat interface for a given period.
Unique Visitors: Indicates how many new/unique visitors started the conversation for a given period.

- Average conversations per day
This metric shows on average how many conversations are happening per day for a given period. This also compares the data with the previous period. For example, if you select the current month it will compare results with the past month and will show how to chat interface is performing after comparison.
This helps you in understanding the rate of % increase or decrease in conversations over time.

- % Contact Conversion
This is an important metric to know how many visitors have shared their contact information. This contact information is useful to re-target the visitors later. You can export these contacts to various CRM applications supported by us.
This also compares the data with the previous period. For example, if you select the current month it will compare results with the past month and will show how the rate of % increase or decrease in contact conversions.
Contacts are basically captured from multiple sources like; Live chat, Offline form, and chat conversation.

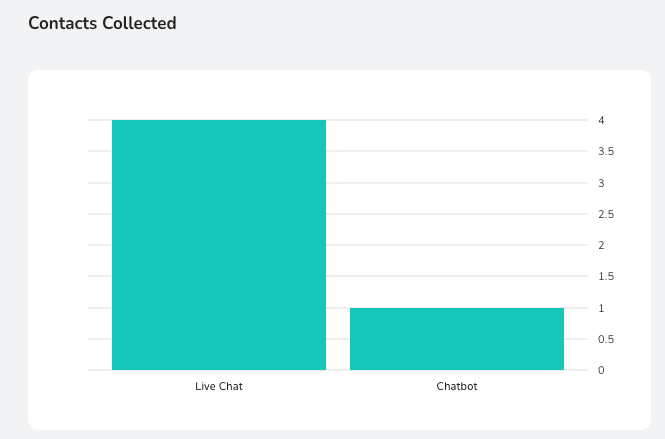
- Contacts collected
This metric shows how many contacts are collected from various sources for a given period.
Sources supported to collect contacts are:
Live chat, a chatbot (chat interface), offline form.

- Top sources
This metric is useful in understanding from which URL/webpage maximum visitors are interacting with the chat interface. This helps in deciding on what pages the chat interface is performing better and which bounce rate is low.
Currently, this metric can show the data for the top 5 sources.

- Drop-off performance
This metric helps in understanding the drop-off source during live chat/video chat. It shows who ended the conversation.

Conversations
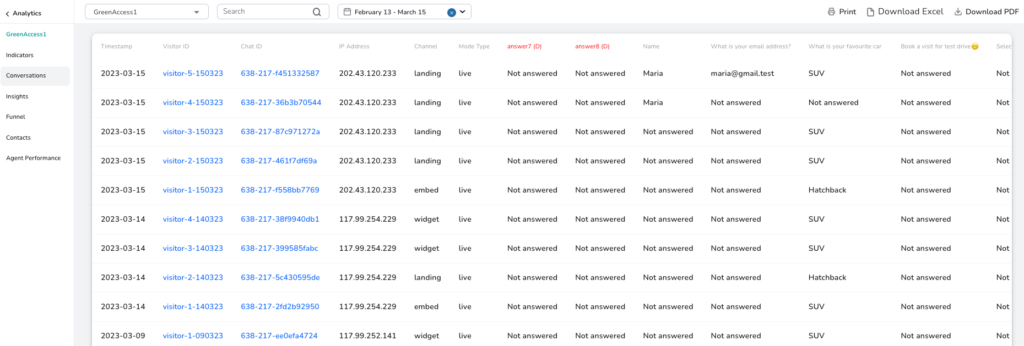
This page will show the list of all conversations started with the chat interface for a specific period. A default list is displayed for the past 30 days.
Each row on this page refers to the unique conversation visitor had with the chat interface.
Each column refers to the Question and the answers given by the visitor.
Some initial columns shown are fixed and that shows visitor details.
It is also possible to download these conversations in .CSV and .PDF format.
To quickly show visitor information click on Visitor ID record.
To quickly show chat history, click on Chat ID record.
Refer screenshot below to understand this page in detail.

Insights
This page helps in doing option analysis on specific components where choices were given to visitors to respond.
It basically shows how many times a specific choice is used as a response.
Data visualization in donut form helps in understanding the results better.
Refer screenshot below to know this better.
Choose a specific question to see the required results.
In the screenshot you can see, 124 times the question was answered and 6 times not answered (dropped).
Also on the right side, you can see, which choice (option) is selected most while answering the question.
By default results are shown for the last 30 days.

Funnel
This feature helps in understanding which question in the flow creates friction/bottleneck.
Also, this gives statistics about what is the bounce rate of each question.
Step 1: First you need to select questions for which funnel needs to be created. Then click on Create Funnel. You can use the option “Select all questions” to create a funnel for all questions.
Step 2: See the funnel result. Each question will have a matching bar in the funnel chart, this can be identified by the question number on the right side of each bar. (example: Q.1).
On the rightmost side of the screen, you will see the details, this shows conversations to contact conversion.


Contacts
What is contact?
Contact is captured when a visitor submits the information in the chat interface which can be used to contact them.
Like, if the visitor submits, an email, phone, name, etc. It will be saved as a contact, provided criteria to capture the contact info is enabled at the component level in Builder – Conversation for each specific question.
These contacts can be saved in your local system in.CSV or .PDF format.
We also support integrations with various external CRM applications. Use these integrations to export the contacts to your CRM application.

Agent Performance
This page is specifically dedicated to monitoring the Agent’s performance.
It shows metrics that help in understanding how agents are responding to incoming requests, human takeovers, etc.
The data shown on this page requires selecting the chat interface and the agent.
In the screenshot below,
First donut shows, Live chat to Contact conversion which means how many conversations are converted to a contact.
The second donut shows, how many contacts were created after taking a human takeover.


